


This week the IN campaign admitted that there can be no upper limit to migration if we stay in the EU.
New research released shows the devastating impact of uncontrolled migration on our schools.
Commenting, Priti Patel MP said:
‘The EU is undemocratic and interferes too much in our daily lives. We have seen that with the scale of migration, and the impact this has had on local communities – and key public services such as the NHS, housing and schools. With more countries waiting to join the EU, including Albania, Serbia, and Turkey – and with British taxpayers paying almost £2 billion to help them join – this problem can only get worse.
‘This research proves that class sizes are already overstretched, with an 8% increase over the last year in the number of pupils in classes over 30. These demands will only increase if the UK remains in the EU with no control over its borders.
‘Thursday offers a once in a lifetime opportunity to say that the situation is unsustainable – and to recognise that it is hurting British families. On Thursday, we have the chance to take back control and Vote Leave.’
Research shows if Britain remains in the EU, these problems will get worse:
-
100,800 infants are now educated in classes over the legal limit of 30 pupils per class – an increase of 8% on the previous year.
-
Currently one in five primary school children has a first language other than English – in state funded primary schools it is 19.4%, in primary academies it is 19.3%.
-
11.6% of children currently fail to get into their first choice primary school.
-
If the EU remains at its current size, we can expect an additional 261,000 school age European citizens to be in the UK school system by 2030. This could increase to 571,000 if the ‘A5’ accession countries (Albania, Macedonia, Montenegro, Serbia and Turkey) join in the near future, as currently planned.
-
The increase in school age European citizens is likely to cost between £12.3 billion and £21.7 billion.
-
Added to this, there are also capital costs needed to accommodate these extra children, estimated to range between £3.4 billion and £7.3 billion.
-
Added together, the total additional cost to the UK schools budget of this increase in the school age population due to EU migration can therefore be expected to range between £15.6 billion (assuming the A5 countries don’t join) and £28.9 billion (assuming they do join). The additional annual cost by 2030 will be between £1 billion to £1.9 billion per year.
The scale of the problem
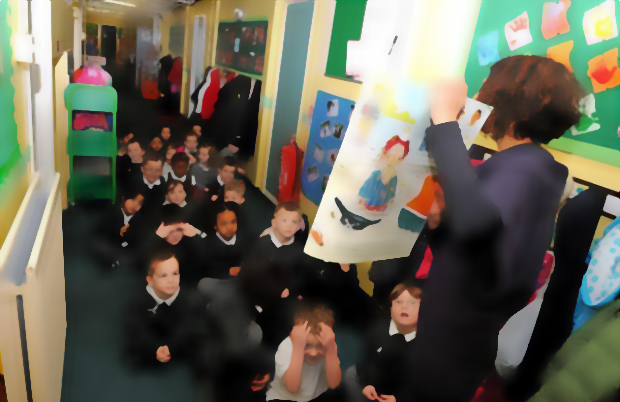
Britain’s schools are under pressure from uncontrolled EU immigration. David Cameron has admitted, ‘in some areas, the number of migrants we’re seeing is far higher than our local authorities, our schools and our hospitals can cope with. They’re much higher than anything the EU has known before in its history’. This has caused a number of problems for many schools: something that the Prime Minister has also admitted: ‘There are primary schools where dozens of languages are spoken, with only a small minority speaking English as their first language’.
These claims are supported by official statistics from the Government:
100,800 infants are now educated in classes over the legal limit of 30 pupils per class – an increase of 8% on the previous year.
Currently one in five primary school children has a first language other than English – in state funded primary schools it is 19.4%, in primary academies it is 19.3%.
11.6% of children currently fail to get into their first choice primary school.
16% don’t get into their first choice secondary school.
New research shows that the pressures identified by the Prime Minister are set to get far more severe over the next fifteen years.
School-age migration from the EU since the A8 accession
The Chief Executive of the UK Statistics Authority has recently confirmed the high numbers of children migrating to the UK from other EU member states. From 2000-2014, 152,000 EU migrants of school age came to the UK.
|
EEA school-age migration, 2000-2014 |
|||||
|
2000 |
2001 |
2002 |
2003 |
2004 |
Average |
|
10,000 |
4,000 |
2,000 |
10,000 |
3,000 |
5,800 |
|
2005 |
2006 |
2007 |
2008 |
2009 |
Average |
|
3,000 |
6,000 |
8,000 |
14,000 |
10,000 |
8,200 |
|
2010 |
2011 |
2012 |
2013 |
2014 |
Average |
|
13,000 |
13,000 |
16,000 |
14,000 |
25,000 |
16,200 |
|
Total, 2000-2014 |
152,000 |
||||
Source: UK Statistics Authority, 3 May 2016.
These numbers are on a steep upward trajectory. From 2000-2004, the average number of school-age EEA migrants per year was 5,800. This rose to 8,200 in 2005-2009. It then nearly doubled to 16,200 in the period 2010-2014. This trend has been especially clear since the accession of the eastern European member states in 2004. It also increased at an unprecedented rate in the last year of recorded data.
Source: UK Statistics Authority, 3 May 2016.
Over the same period, around 1 million net migrants came to the UK from the EU, 515,000 of whom were from the EU8 accession states.
|
EU total and school-age net migration compared |
||||
|
Year |
EU total |
EU8 total |
EU school |
EU8 school |
|
2000 |
6,000 |
– |
10,000 |
|
|
2001 |
7,000 |
– |
4,000 |
|
|
2002 |
7,000 |
– |
2,000 |
|
|
2003 |
15,000 |
– |
10,000 |
|
|
2004 |
87,000 |
49,000 |
3,000 |
|
|
2005 |
96,000 |
61,000 |
3,000 |
|
|
2006 |
104,000 |
71,000 |
6,000 |
|
|
2007 |
127,000 |
87,000 |
8,000 |
|
|
2008 |
63,000 |
20,000 |
14,000 |
|
|
2009 |
58,000 |
16,000 |
10,000 |
|
|
2010 |
77,000 |
49,000 |
13,000 |
|
|
2011 |
82,000 |
40,000 |
13,000 |
|
|
2012 |
82,000 |
30,000 |
16,000 |
|
|
2013 |
123,000 |
44,000 |
14,000 |
|
|
2014 |
174,000 |
48,000 |
25,000 |
|
|
Total |
1,108,000 |
515,000 |
151,000 |
52,000 |
Source: ONS, 2015; ONS, May 2016; UKSA, 3 May 2016.
The school-age migrants as a percentage of the total was therefore as follows:
-
All EU states: 13.6%.
-
EU8 accession states: 10.1%.
The number of children in the UK of school age with one or more parent of EU/EEA nationality more than doubled between 2007 and 2015:
|
Total school-age population with one or both parents of EEA nationality |
|
|
2007 |
309,000 |
|
2008 |
326,000 |
|
2009 |
361,000 |
|
2010 |
432,000 |
|
2011 |
475,000 |
|
2012 |
419,000 |
|
2013 |
520,000 |
|
2014 |
565,000 |
|
2015 |
699,000 |
Source: UK Statistics Authority, 29 April 2016.
Future school-age migration
A conservative estimate of future school-age migration from the EU is that one in ten migrants will be of school age. This allows for a forecast of future school-age migration from the EU to be calculated. Vote Leave has already set out forecasts for future inward migration. It is possible to adapt these models to calculate future school-age migration from the EU. This provides:
-
A baseline forecast, in which the candidate countries do not accede to the EU.
-
A low forecast, under which the accession countries join in 2020 and migrate to the UK at the same rate as the EU-8 countries did.
-
A medium forecast is that net EU migration mirrors migration from the EU-2 countries.
-
A high forecast – which builds on the medium forecast, and takes into account the pull factor of the national living wage.
We also include a scenario in which transitional controls are imposed for a period of seven years from 2020 until the end of 2027, the duration of transitional controls following the A2 accessions in 2007. This forecast assumes the same migration as in the case of the baseline until 2028, and the increases in net migration that occur under the low forecast thereafter).
|
Future school-age migration from the EU (cumulative) |
|||||
|
Year |
Baseline |
Transitional Controls |
Low Forecast |
Medium Forecast |
High Forecast |
|
2016 |
18,400 |
18,400 |
18,400 |
18,400 |
18,400 |
|
2017 |
36,800 |
36,800 |
36,800 |
36,800 |
38,148 |
|
2018 |
55,200 |
55,200 |
55,200 |
55,200 |
58,648 |
|
2019 |
73,600 |
73,600 |
73,600 |
73,600 |
79,900 |
|
2020 |
92,000 |
92,000 |
94,061 |
98,114 |
110,118 |
|
2021 |
110,400 |
110,400 |
116,583 |
128,743 |
148,548 |
|
2022 |
128,800 |
128,800 |
141,166 |
165,485 |
195,192 |
|
2023 |
147,200 |
147,200 |
165,748 |
202,228 |
241,836 |
|
2024 |
165,600 |
165,600 |
190,331 |
238,970 |
288,480 |
|
2025 |
184,000 |
184,000 |
214,914 |
275,713 |
335,124 |
|
2026 |
202,400 |
202,400 |
239,497 |
312,456 |
381,767 |
|
2027 |
220,800 |
220,800 |
264,080 |
349,198 |
428,411 |
|
2028 |
239,200 |
241,261 |
288,662 |
385,941 |
475,055 |
|
2029 |
239,200 |
245,383 |
294,845 |
404,283 |
503,299 |
|
2030 |
239,200 |
251,566 |
301,028 |
422,626 |
530,195 |
Children born to EU parents in the UK
In 2014, 76,650 children were born in the UK to a parent or parents from the EU.
|
Children born to EU parents in the UK |
||
|
Number |
% total births |
|
|
Father from EU |
50,512 |
7.3 |
|
Mother from EU |
64,067 |
9.2 |
|
Both parents from EU |
37,929 |
5.5 |
|
One or both parents from EU |
76,650 |
11.0 |
Source: ONS, August 2015.
These numbers are rising, as the long-term trend for those born in England and Wales to mothers from the EU shows.
|
Children born to EU mothers, England & Wales |
||
|
Year |
Number |
% of total births |
|
2008 |
44,022 |
6.2 |
|
2009 |
47680 |
6.8 |
|
2010 |
52,868 |
7.3 |
|
2011 |
55,194 |
7.6 |
|
2012 |
59,061 |
8.1 |
|
2013 |
60,448 |
8.7 |
|
2014 |
64,067 |
9.2 |
Source: ONS, August 2015.
Children born to future EU migrants
The current birth rate in England and Wales is 12.1 births per thousand of the population. Assuming this will be the birth rate for future EU migrants, the table below indicates the number of children expected to be born to net EU migrants coming to the UK between now and 2030. It should be stressed that the totals at the bottom of the table do not include children born to EU migrants who arrived before this year.
|
Births to EU net migrants arriving from 2016 |
|||||
|
Year |
Baseline |
Transitional Controls |
Low Forecast |
Medium Forecast |
High Forecast |
|
2016 |
2,226 |
2,226 |
2,226 |
2,226 |
2,226 |
|
2017 |
4,453 |
4,453 |
4,453 |
4,453 |
4,616 |
|
2018 |
6,679 |
6,679 |
6,679 |
6,679 |
7,096 |
|
2019 |
8,906 |
8,906 |
8,906 |
8,906 |
9,668 |
|
2020 |
11,132 |
11,132 |
11,381 |
11,872 |
13,324 |
|
2021 |
13,358 |
13,358 |
14,107 |
15,578 |
17,974 |
|
2022 |
15,585 |
15,585 |
17,081 |
20,024 |
23,618 |
|
2023 |
17,811 |
17,811 |
20,056 |
24,470 |
29,262 |
|
2024 |
20,038 |
20,038 |
23,030 |
28,915 |
34,906 |
|
2025 |
22,264 |
22,264 |
26,005 |
33,361 |
40,550 |
|
2026 |
24,490 |
24,490 |
28,979 |
37,807 |
46,194 |
|
2027 |
26,717 |
26,717 |
31,954 |
42,253 |
51,838 |
|
2028 |
28,943 |
29,193 |
34,928 |
46,699 |
57,482 |
|
2029 |
33,396 |
31,918 |
37,903 |
51,145 |
63,126 |
|
2030 |
33,396 |
34,892 |
40,877 |
55,591 |
68,769 |
Assuming that the children born to EU migrants will enter the school system five years after their birth, it is possible to combine the figures for the number of school age migrants from the EU and the number of births to EU migrants. Adding these two figures together reveals the total number of new persons of school age due to EU migration for the next fifteen years.
|
Persons added to school population due to EU net migration |
|||||
|
Baseline |
Transitional Controls |
Low Forecast |
Medium Forecast |
High Forecast |
|
|
2016 |
18,400 |
18,400 |
18,400 |
18,400 |
18,400 |
|
2017 |
36,800 |
36,800 |
36,800 |
36,800 |
38,148 |
|
2018 |
55,200 |
55,200 |
55,200 |
55,200 |
58,648 |
|
2019 |
73,600 |
73,600 |
73,600 |
73,600 |
79,900 |
|
2020 |
92,000 |
92,000 |
94,061 |
98,114 |
110,118 |
|
2021 |
112,626 |
112,626 |
118,809 |
130,969 |
150,775 |
|
2022 |
133,253 |
133,253 |
145,618 |
169,938 |
199,808 |
|
2023 |
153,879 |
153,879 |
172,428 |
208,907 |
248,932 |
|
2024 |
174,506 |
174,506 |
199,237 |
247,876 |
298,148 |
|
2025 |
195,132 |
195,132 |
226,295 |
287,585 |
348,448 |
|
2026 |
215,758 |
215,758 |
253,603 |
328,034 |
399,742 |
|
2027 |
236,385 |
236,385 |
281,161 |
369,222 |
452,029 |
|
2028 |
257,011 |
259,072 |
308,718 |
410,410 |
504,317 |
|
2029 |
259,238 |
265,420 |
317,875 |
433,199 |
538,205 |
|
2030 |
261,464 |
273,830 |
327,033 |
455,987 |
570,745 |
|
Total |
2,275,252 |
2,295,861 |
2,628,838 |
3,324,241 |
4,016,362 |
|
Average |
151,683 |
153,057 |
175,256 |
221,616 |
267,757 |
School funding
Schools in England have three main streams of current revenue: the Dedicated Schools Grant (Schools and High Needs Blocks), the Pupil Premium and the Education Services Grant (ESG). If these are added together and then divided by the number of schools pupils, it is possible to calculate education spending per pupil.
|
Education Funding |
||||||
|
Schools Block (2016-17) (£m) |
High Needs Block (2016-17) (£m) |
Pupil Premium (2015-16) (£m) |
ESG (2016-17) (£m) |
Total Funding (£m) |
No. pupils |
Total funding per pupil (£) |
|
32,649 |
5,229.87 |
2,411 |
507 |
40,867 |
7,041,321 |
5,803.89 |
Source: Education Funding Agency, 2016; Education Funding Agency, 2015; Education Funding Agency, 27 April 2016
As the 2016 cohort passes through the school system, each pupil will cost on average £5,803.89 per year. By assuming that per pupil funding remains at today’s levels, it is possible to calculate the cost of future school-age migration from the EU to the UK as set out above. In each cohort, we must allow for a certain proportion who will not enter state education: a generous assumption is that this is 7% (the same as the general proportion of children who attend independent schools in England).
Combining the figures above gives an estimate of the total costs, both current and capital.
|
Combined current and capital costs |
|||||
|
Baseline (£bn) |
Transitional Controls (£bn) |
Low (£bn) |
Medium(£bn) |
High (£bn) |
|
|
Total current (£bn) |
12.28 |
12.39 |
14.19 |
17.94 |
21.68 |
|
Total capital (£bn) |
3.35 |
3.51 |
4.19 |
5.84 |
7.31 |
|
Total current and capital (£bn) |
15.63 |
15.90 |
18.38 |
23.79 |
28.99 |
|
Total per year (£bn) |
1.04 |
1.06 |
1.23 |
1.59 |
1.93 |
The total cost to the schools budget of EU migration from 2016 to 2030 is therefore expected to range between £15.6 billion and £28.9 billion. This is an annual cost of between £1 billion to £1.9 billion per year. It is worth noting finally that these are conservative estimates since they do not include: the cost of purchasing land for new schools; early-years education; pre-2016 EU migration, or migration of those under five years of age. The actual cost of a remain vote to our schools budget is likely to be far higher.


